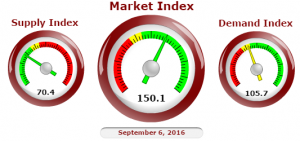
The Phoenix Housing Market can be described in 2 ways: “under stocked” and “stable.” In this edition of our August 2016 Phoenix Housing Market summary we’ll report on some of the key indicators.
Housing Sales
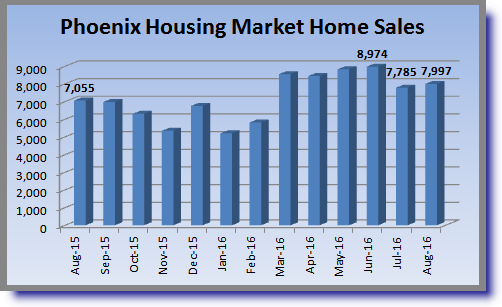
Housing sales as of August are averaging 7,680 per month. The below chart is typical of our cyclical sales. Home sales are lowest in the winter, gain momentum through spring, peak in summer, and slowdown in fall. Only the highs and lows change each year.
 As you read our August 2016 Phoenix Housing Market summary be aware that home sales are recorded only during business days. While this may seem like common sense, it’s also common sense that months with less working days will generally have less sales than the months that precede and follow them. This becomes particularly important for statisticians who compare year-over-year and month-to-month sales.
- July 2015 had 22 working days
- July 2016 had 20 working days (10% fewer)
- August 2015 had 21 working days
- August 2016 had 23 working days (10% more)
Active Listing Inventory
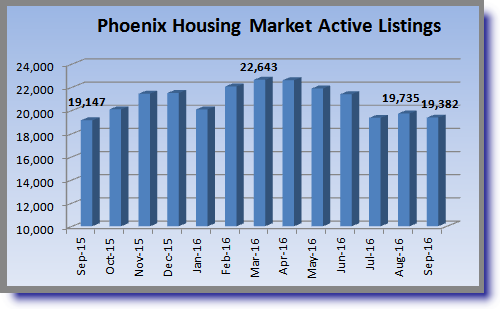
![]() Low inventory has been a factor since the summer of 2014 when it dropped below the Phoenix area “normal” of 26,000 listings. MLS listings peaked at only about 3,500 below normal even before the peak demand season of summer . This would seem to indicate most home sellers are happy where they are currently living.
Low inventory has been a factor since the summer of 2014 when it dropped below the Phoenix area “normal” of 26,000 listings. MLS listings peaked at only about 3,500 below normal even before the peak demand season of summer . This would seem to indicate most home sellers are happy where they are currently living.
Price Per Square Foot
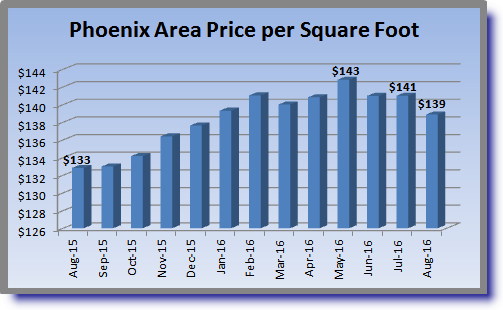
This key indicator continued to drop. This is contrary to what you might expect during a home seller’s market. A good portion of this drop was due to diminishing luxury home sales. The below chart illustrates this concept with all home sales over $1,000,000:
- 141-May 2016
- 132-June 2016
- 92-July 2016
- 94-August 2016
The average price per square foot of these 459 sales was $328. Luxury home sales in July and August were 32% lower than the previous 2 months. Do you think that affected price per square foot?
Days on Market
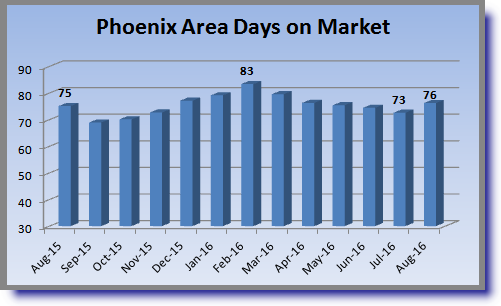
2016 has been a very steady year for another key indicator called “days on market.” Days on market indicates the period of time when a property hits the MLS to when it goes under contract. The average time to contract for the last 13 months is 75 days. You can see there is very little deviation from the average.
August 2016 Phoenix Housing Market Summary
We are still in a home seller’s market across the Valley of the Sun. The highest demand and activity for homes is in the “$250,000 and under” price range. Housing inventory is especially low in these sectors. This chart is the Cromford Market Index™. It illustrates that the demand for housing is fairly average. New MLS listings tend to slow down during the fall and winter months. We can expect more of the same.
